How Sentinel Visualizer is a Superior Alternative to Harris/IBM's i2 Analyst's Notebook
Free TrialBackground
 Whether you're in the intelligence, defense, counter-terrorism, drug interdiction, law enforcement, research, or other data intensive environments, Sentinel
Visualizer will amaze you with its next generation data analysis and visualization features. In fact, it is so impressive that
In-Q-Tel, the CIA's venture capital arm, is an investor in FMS and strong supporter of our efforts to bring
leading edge technology into their mission.
i2 Analyst's Notebook from Harris (formerly IBM) has dominated the data analyst market for years. While the technology was leading edge when it was introduced in the early 1990's, it has fallen behind technologically and fails to meet the demanding needs of today's analyst.
To clear any confusion, this page summarizes the significant advantages of Sentinel Visualizer over Analyst's Notebook. Discover why so many organizations choose Sentinel Visualizer as an alternative to Analyst's Notebook for their most demanding needs.
Committed to Supporting the Analyst
 For 30+ years, FMS has created commercial-off-the-shelf (COTS) software for end-users with customers in over 100 countries. Philosophically, we
strive to empower our customers to maximize the value of their data, support the open exchange of data, and establish trust. And we do so with a modern,
intuitive user interface that requires minimal training.
Modern User Interface
 Developed with Microsoft Visual Studio .NET, Sentinel Visualizer uses leading edge technology with a modern intuitive user interface. The user interface is
very intuitive with right mouse click support, detachable panels, and multi-monitor support. Multiple ways to display and analyze data are all built-in and easy
to apply, minimizing the need for extensive training to get up and running.
No Dongle: We Trust You
 Nothing screams "I don't trust you" more than
requiring a hardware dongle. Harris/IBM i2's Analyst's Notebook forces you to install a hardware dongle in order to start the program.
Sentinel Visualizer does not requires a dongle. We trust you'll abide by our licensing terms, and we are aware of your challenging environments where a dongle is an unnecessary and dangerous burden. Our concurrent licensing feature lets you share your licenses across machines with an internet connection without the need to physically move a dongle from machine to machine.
Open Data Format
 Sentinel Visualizer
stores data in the industry standard Microsoft SQL Server format using SQL Express on your desktop or a network shared SQL Server database. We publish our
schema and provide both data import and export utilities.
Additionally, many of the results in grids can be copied to Excel or exported to a file, and reports output to many formats such as Adobe PDF.
Analyst's Notebook locks you into a proprietary data format and intentionally prevents you from exporting it. We think this is fundamentally wrong and a huge step backwards. You own the data, not the software firm. Why would you voluntarily put your data into a closed system? Important data grows and evolves over time, and you may need it outside this program later. Don't lock yourself in. With Sentinel Visualizer and SQL Server, you'll always be able to grow with your data and extend it for other missions.
Add Unique Pictures for Each Entity
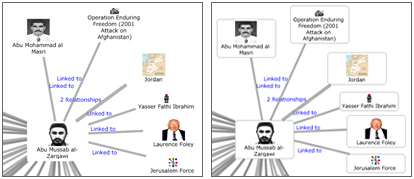
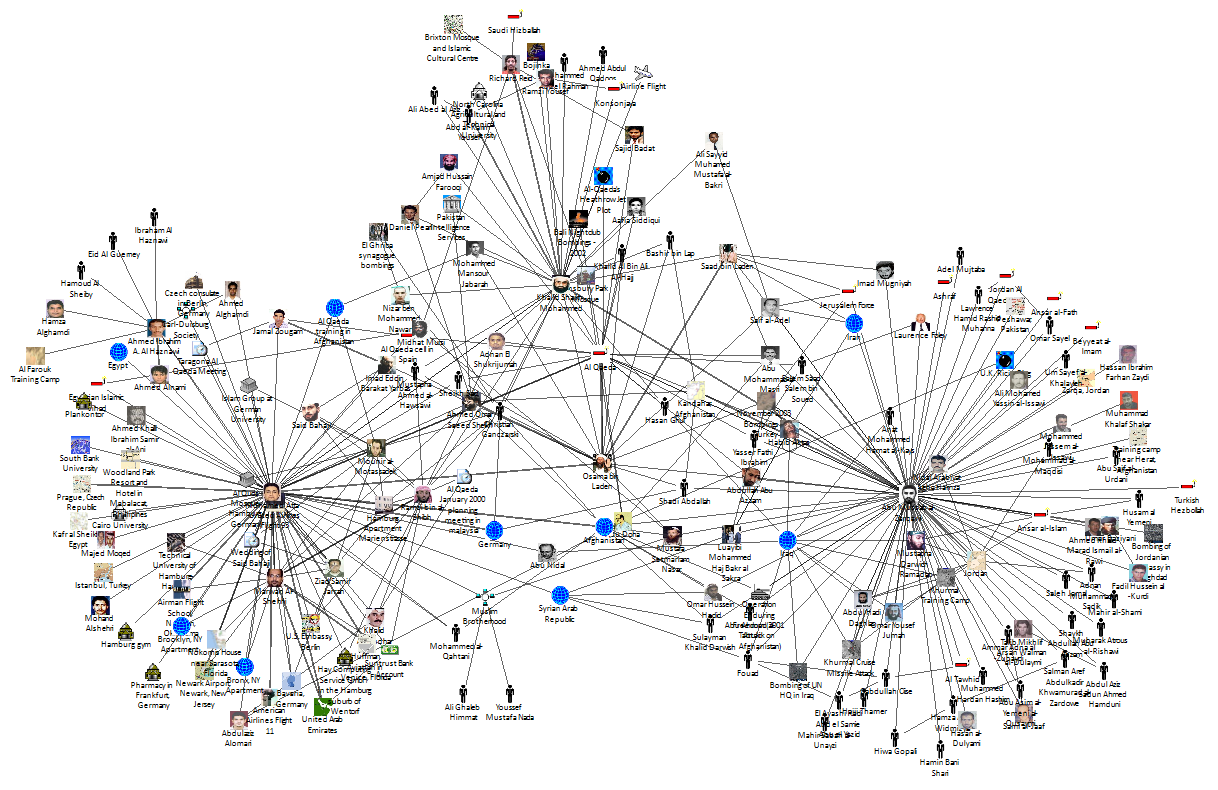
Each entity in Sentinel Visualizer can have its own picture that is displayed directly on your link chart to let you better understand your data. Entities in Analyst's Notebook are shown with a built-in graphic by type (e.g. stick people).
Data Driven, Highly Scalable, and Automated
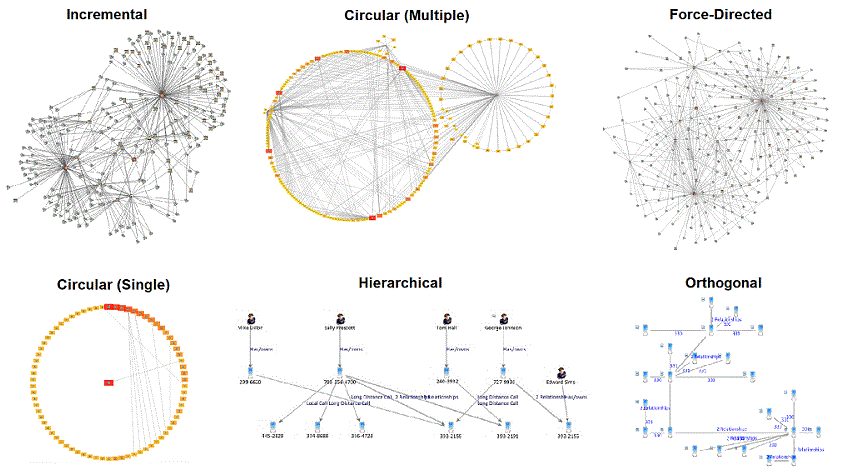
Based on Microsoft SQL Server, Sentinel Visualizer is highly scalable with the ability to support millions of records. Sentinel Visualizer starts from the data and lets its analytic tools show you the results. Advanced redrawing and layout algorithms make it easy to adjust your network when new data is added or existing data filtered. You can also switch between network views such as incremental, circular, hierarchical, etc. Portions of your link chart can be selected and opened in a new link chart window with a mouse click. Whether drilling down from lots of data to an area of interest, or starting from a point and moving out, Sentinel Visualizer lets you quickly and visually analyze your data to find hidden relationships and meaning.
Analyst's Notebook lets you draw charts but it's all manual and not analytical. It may work if you already know what you want to draw, but it's not appropriate when you're trying to learn from your data. Making modifications when new data is added is a cumbersome and tedious process. Filtering data is also a manual chore. Sentinel Visualizer helps you discover new ideas from your data, not simply display what you already know.
Advanced Data Analysis: All Links Are Not Equal
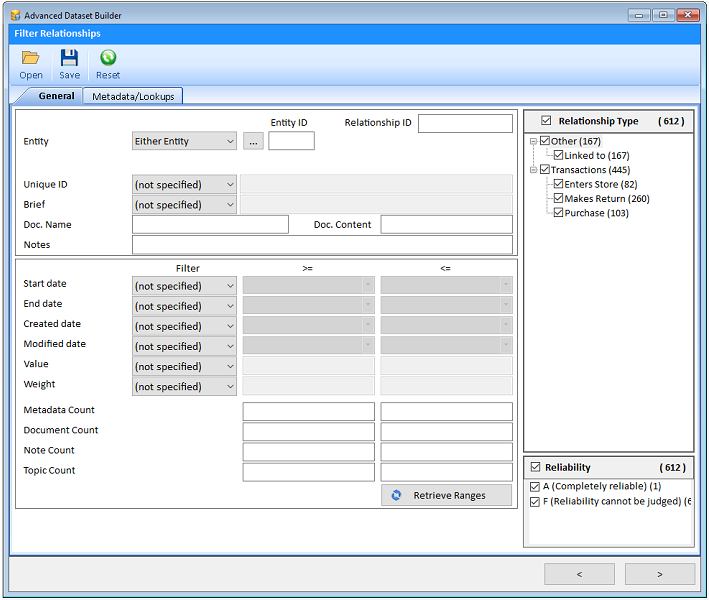
In traditional link analysis, all lines between entities are the same. But in reality, that's a poor representation. Different types of links should be weighted differently (e.g. a brother relationship is very different from two people who attended a meeting). There are also implications based on the source. Sentinel Visualizer takes these concepts into consideration to create a more accurate representation of your network. Relationships between entities can be classified into types that you define and weight.
You can also specify the reliability and credibility of the source. What it all comes down to is relationship lines that are probabilities. They are not all equal. Sentinel Visualizer makes it easy to filter the data based on entity and relationship types (e.g. I only want to see people and their familial relationships). You can also squelch data based on information credibility (e.g. all data for general analysis or only highly credible data for critical decisions).
In Analyst's Notebook, every relationship and line is the same. It may have a different label, but it's not weighted and used for analytic purposes.
Advanced Link Analysis: Shortest Path, All Paths, Common Links
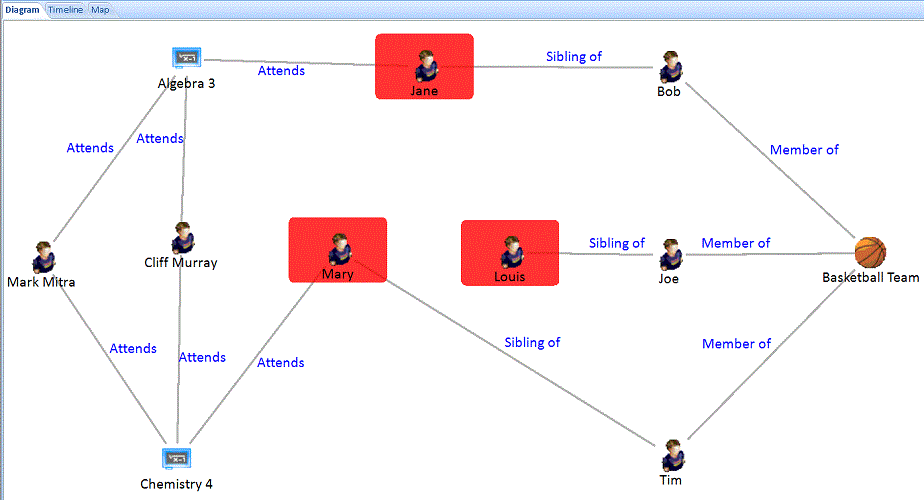
Sentinel Visualizer lets you select any two entities in your network and show the shortest path between them. You can also choose all paths to see how the two parties are linked to each other. Then you can filter out everything else. All with a few mouse clicks.
Sentinel Visualizer also lets you take any two entities and ask how they are connected to each other through the number of links you specify. If you choose one degree, it will quickly retrieve and display all the entities that link to both entities and their relationships. Choose more degrees to see more indirect links. See the multilevel relationships that are extremely difficult to detect without link chart visualization and data analysis.
Analyst's Notebook doesn't offer anything similar and requires manually redrawing the diagram. That's another difference between a drawing program versus a data driven system.

Social Network Analysis (SNA)
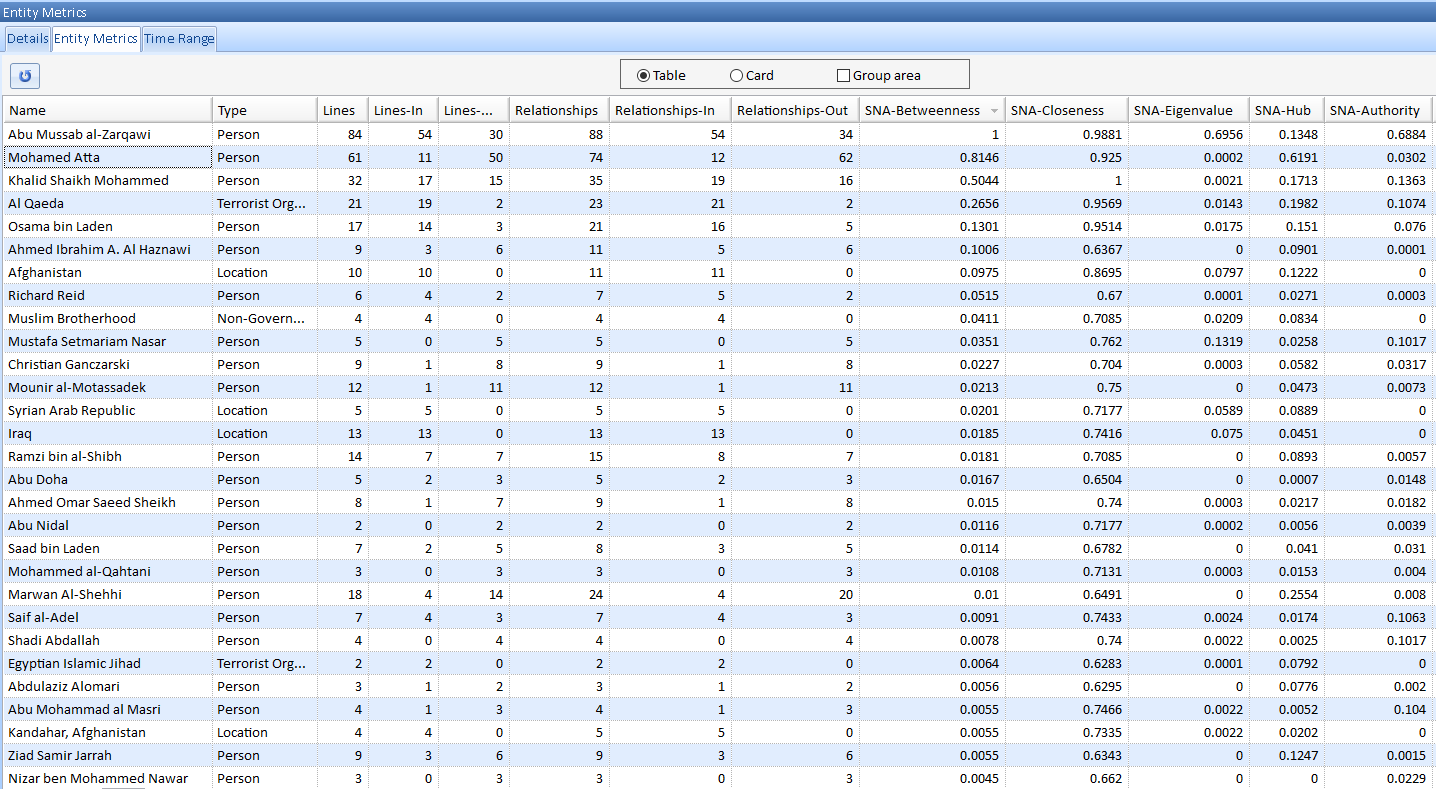
In complex link analysis and networks, it becomes very difficult to understand what's really going on. The science of Social Network Analysis (SNA) helps analysts decipher the complex hidden relationship among entities to quickly identify cells and connections between cells.
Sentinel Visualizer has SNA built into its user interface. Calculate the network metrics and automatically generate the SNA numbers you need for each node. Whether it's degrees, betweenness, closeness, eigenvalue, hub, authority, etc. the numbers are all there. They are can also display on your link chart as color gradients so you can quickly identify key players.
Sentinel Visualizer is the first commercial Social Network Analysis software program for the desktop. Be the first to take what Ph.D.'s create in academic circles, and run it on your desktop with a few mouse clicks. Take advantage of the power of SNA to better understand your network, discover hidden relationships, and find more actionable intelligence.
Integrated Geospatial Mapping
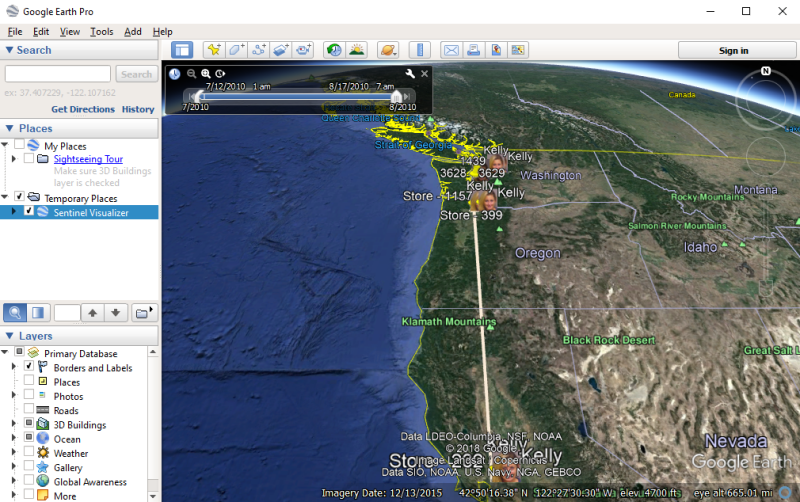
Geospatial Mapping tools are integrated directly into Sentinel Visualizer. If your entities have geographic locations specified, it can be plotted on a map internally or with Google Earth. A GeoQuery feature lets you select entities from a map based on a radius from a point you specify and plot them on your link analysis chart.
Temporal Analysis
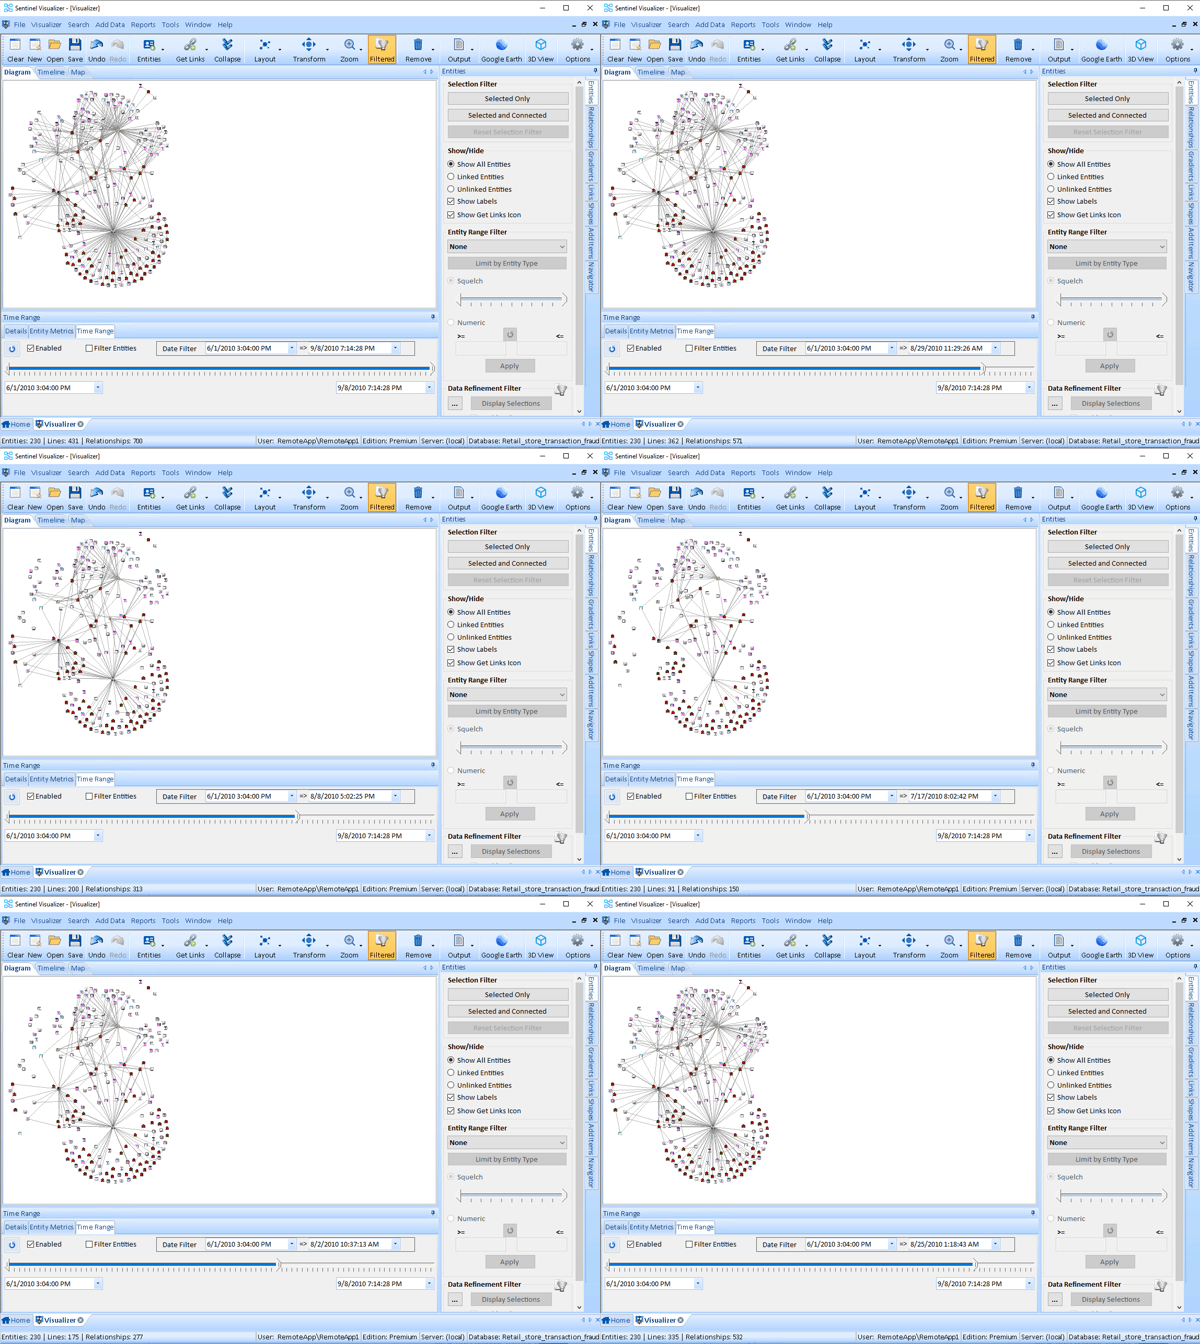
Sentinel Visualizer provides a powerful Temporal Time Range interface that hides or shows data based on a time slider control. Temporal Analysis makes it easy to see how networks form, change, and interact with each other over time. This capability allows you to spot patterns and predict actions and behaviors. The Time Range interface supports ranges down to the second level, and includes the ability to visually define time spans and ranges.
Built-In Multiuser Capabilities
 With Sentinel
Visualizer, you can connect multiple users to the same Microsoft SQL Server database without buying additional tools, libraries, etc.
Modifications made by one user can automatically be seen by others.
Easy Evaluation with Free Trial Version
If you would like more information on our products and services, or how to receive a free evaluation copy of Sentinel Visualizer, please request a free trial.
Customizable to Your Mission
 Sentinel Visualizer contains lookup lists stored in its tables which are fully customizable. Easily edit and augment the data to your situation.
Our services team can also build custom solutions to integrate Sentinel Visualizer with your data and existing applications. Please feel free to Contact Us to discuss your needs.
